
View logs
Monitor authentication activities and webhook deliveries using comprehensive logs that track user sign-ins, authentication methods, and webhook event processing.
Scalekit provides comprehensive logging for both authentication activities and webhook deliveries. Use these logs to monitor user access patterns, troubleshoot authentication issues, debug webhook integrations, and maintain compliance with audit requirements.
Access logs
Section titled “Access logs”Authentication logs: Navigate to Dashboard > Auth Logs to view all authentication events across your environment.
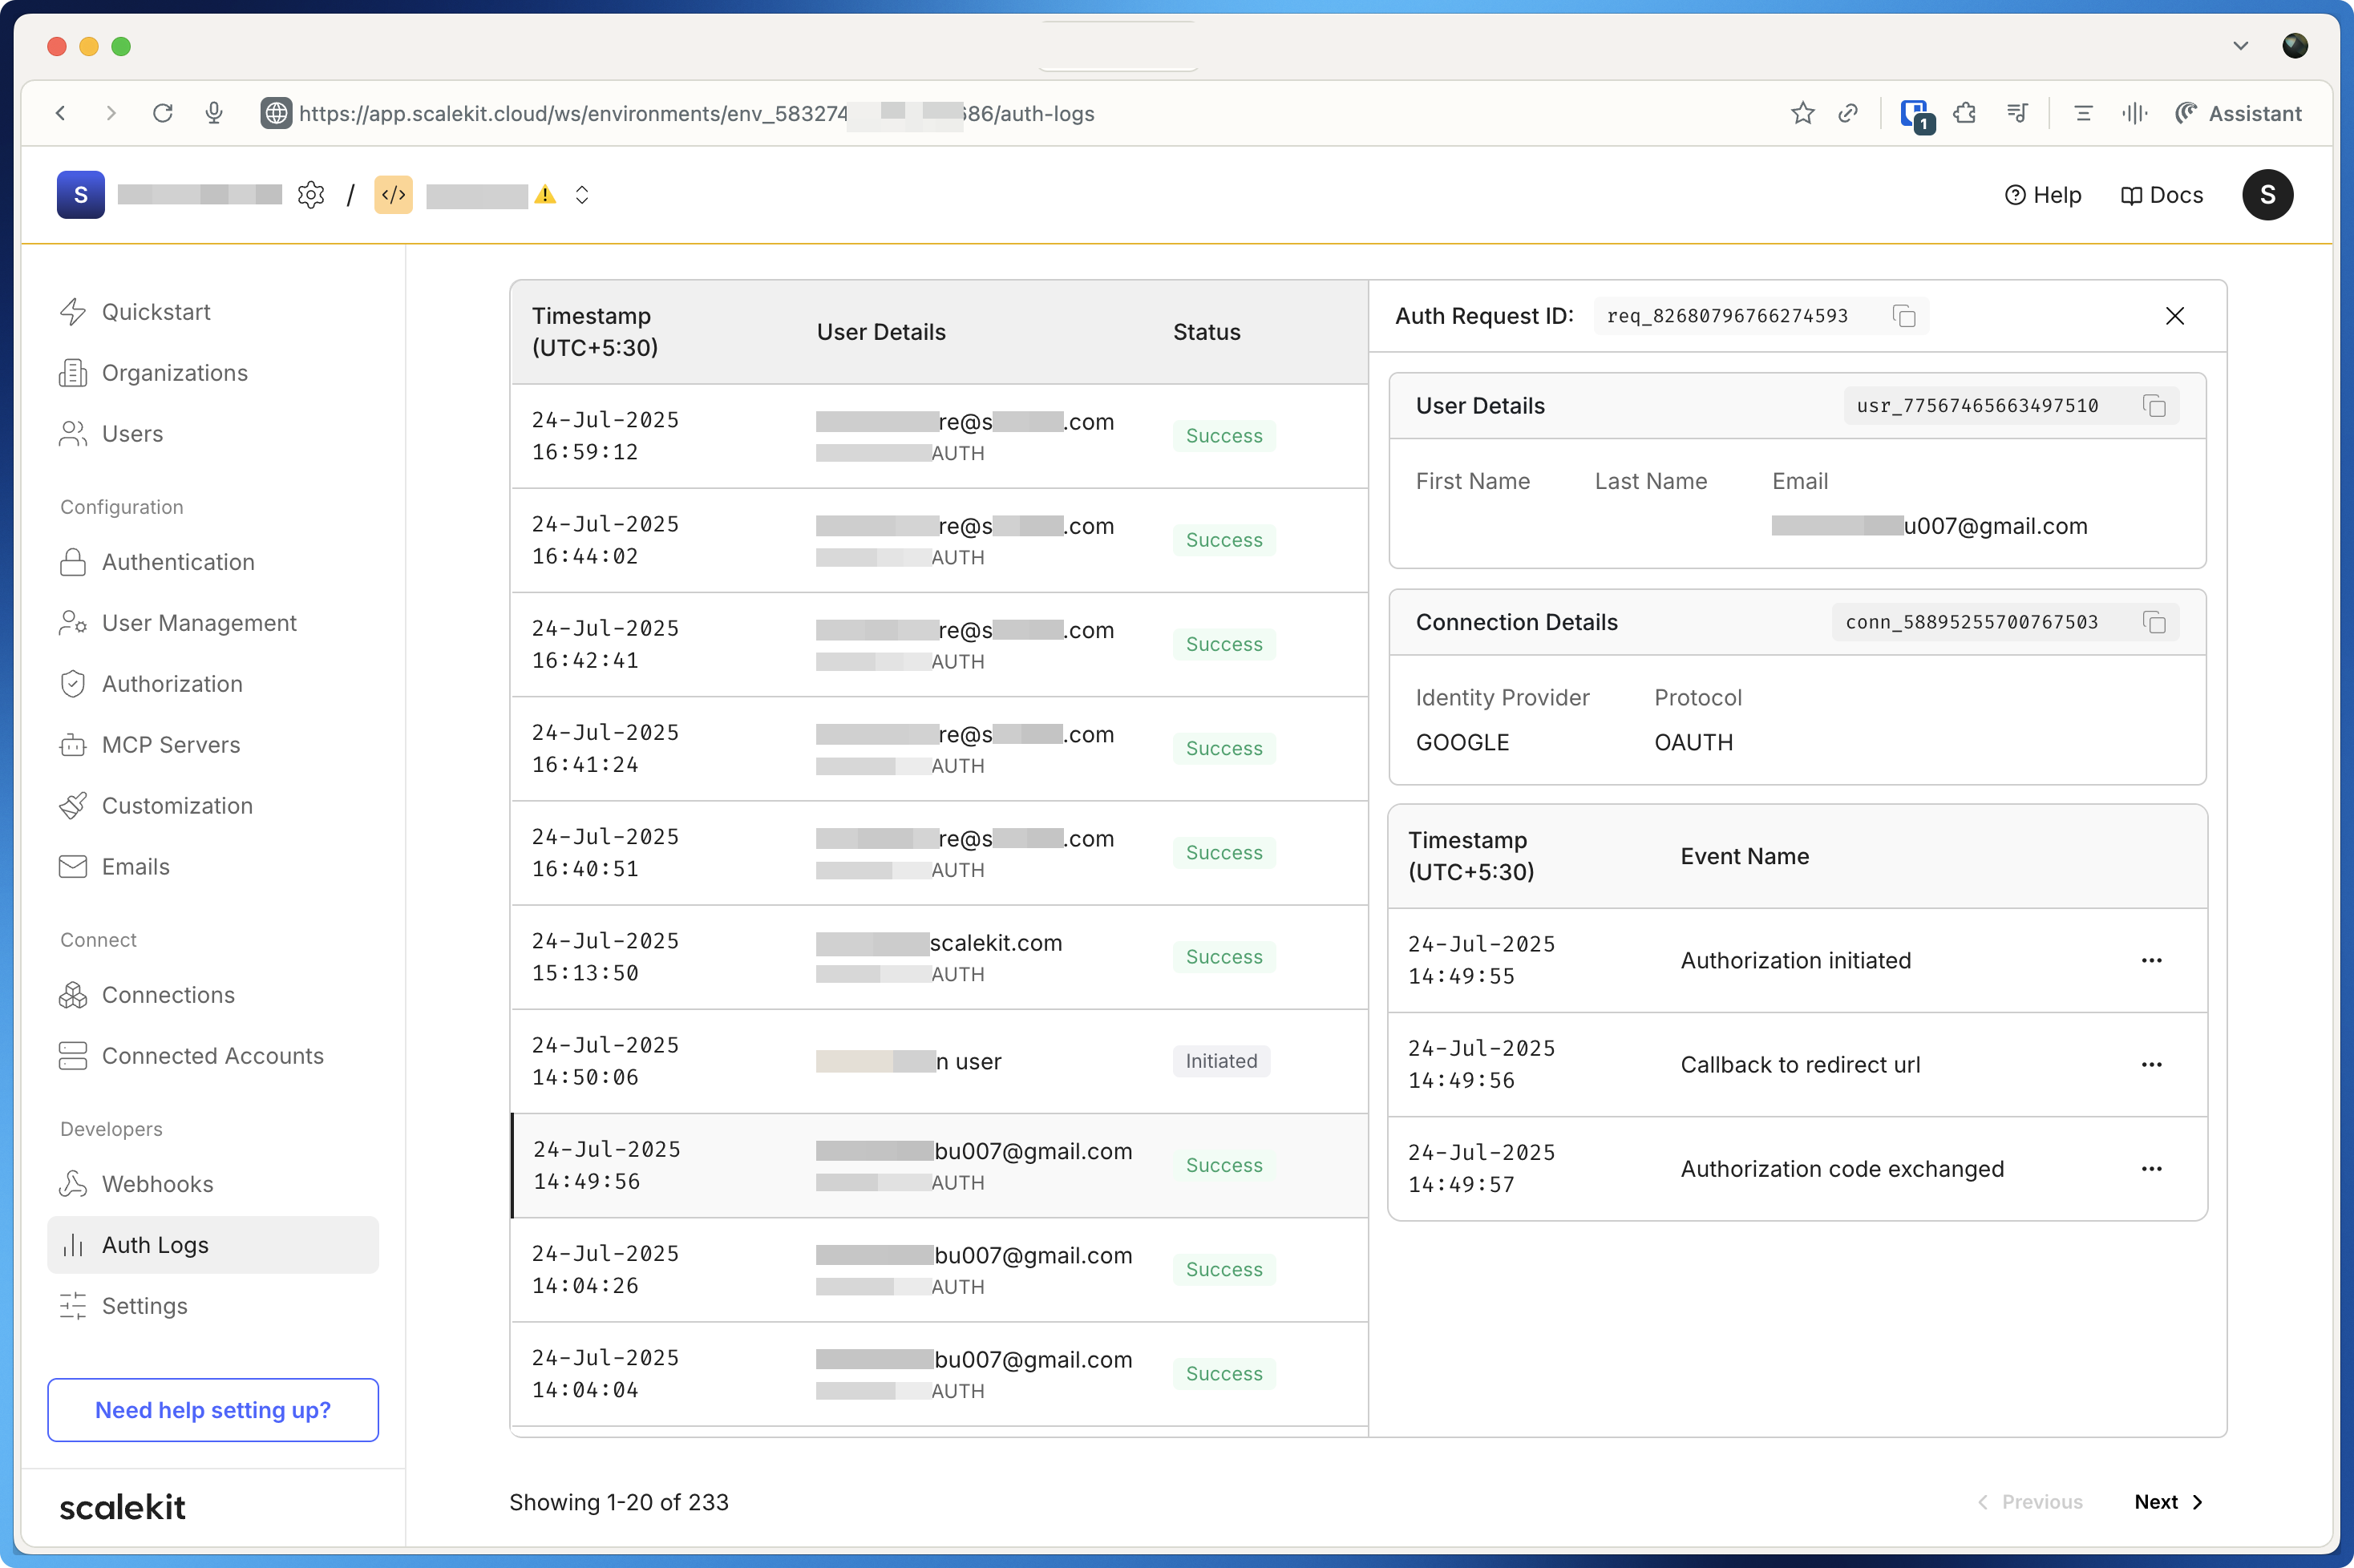
Each auth log entry displays the authentication event details, status, timestamp, user information, and authentication method used.
Webhook logs: Navigate to Dashboard > Webhooks to view all configured webhook endpoints. Click on the specific webhook endpoint you want to monitor, then select the ”…” (more options) button to access detailed delivery logs for that endpoint.
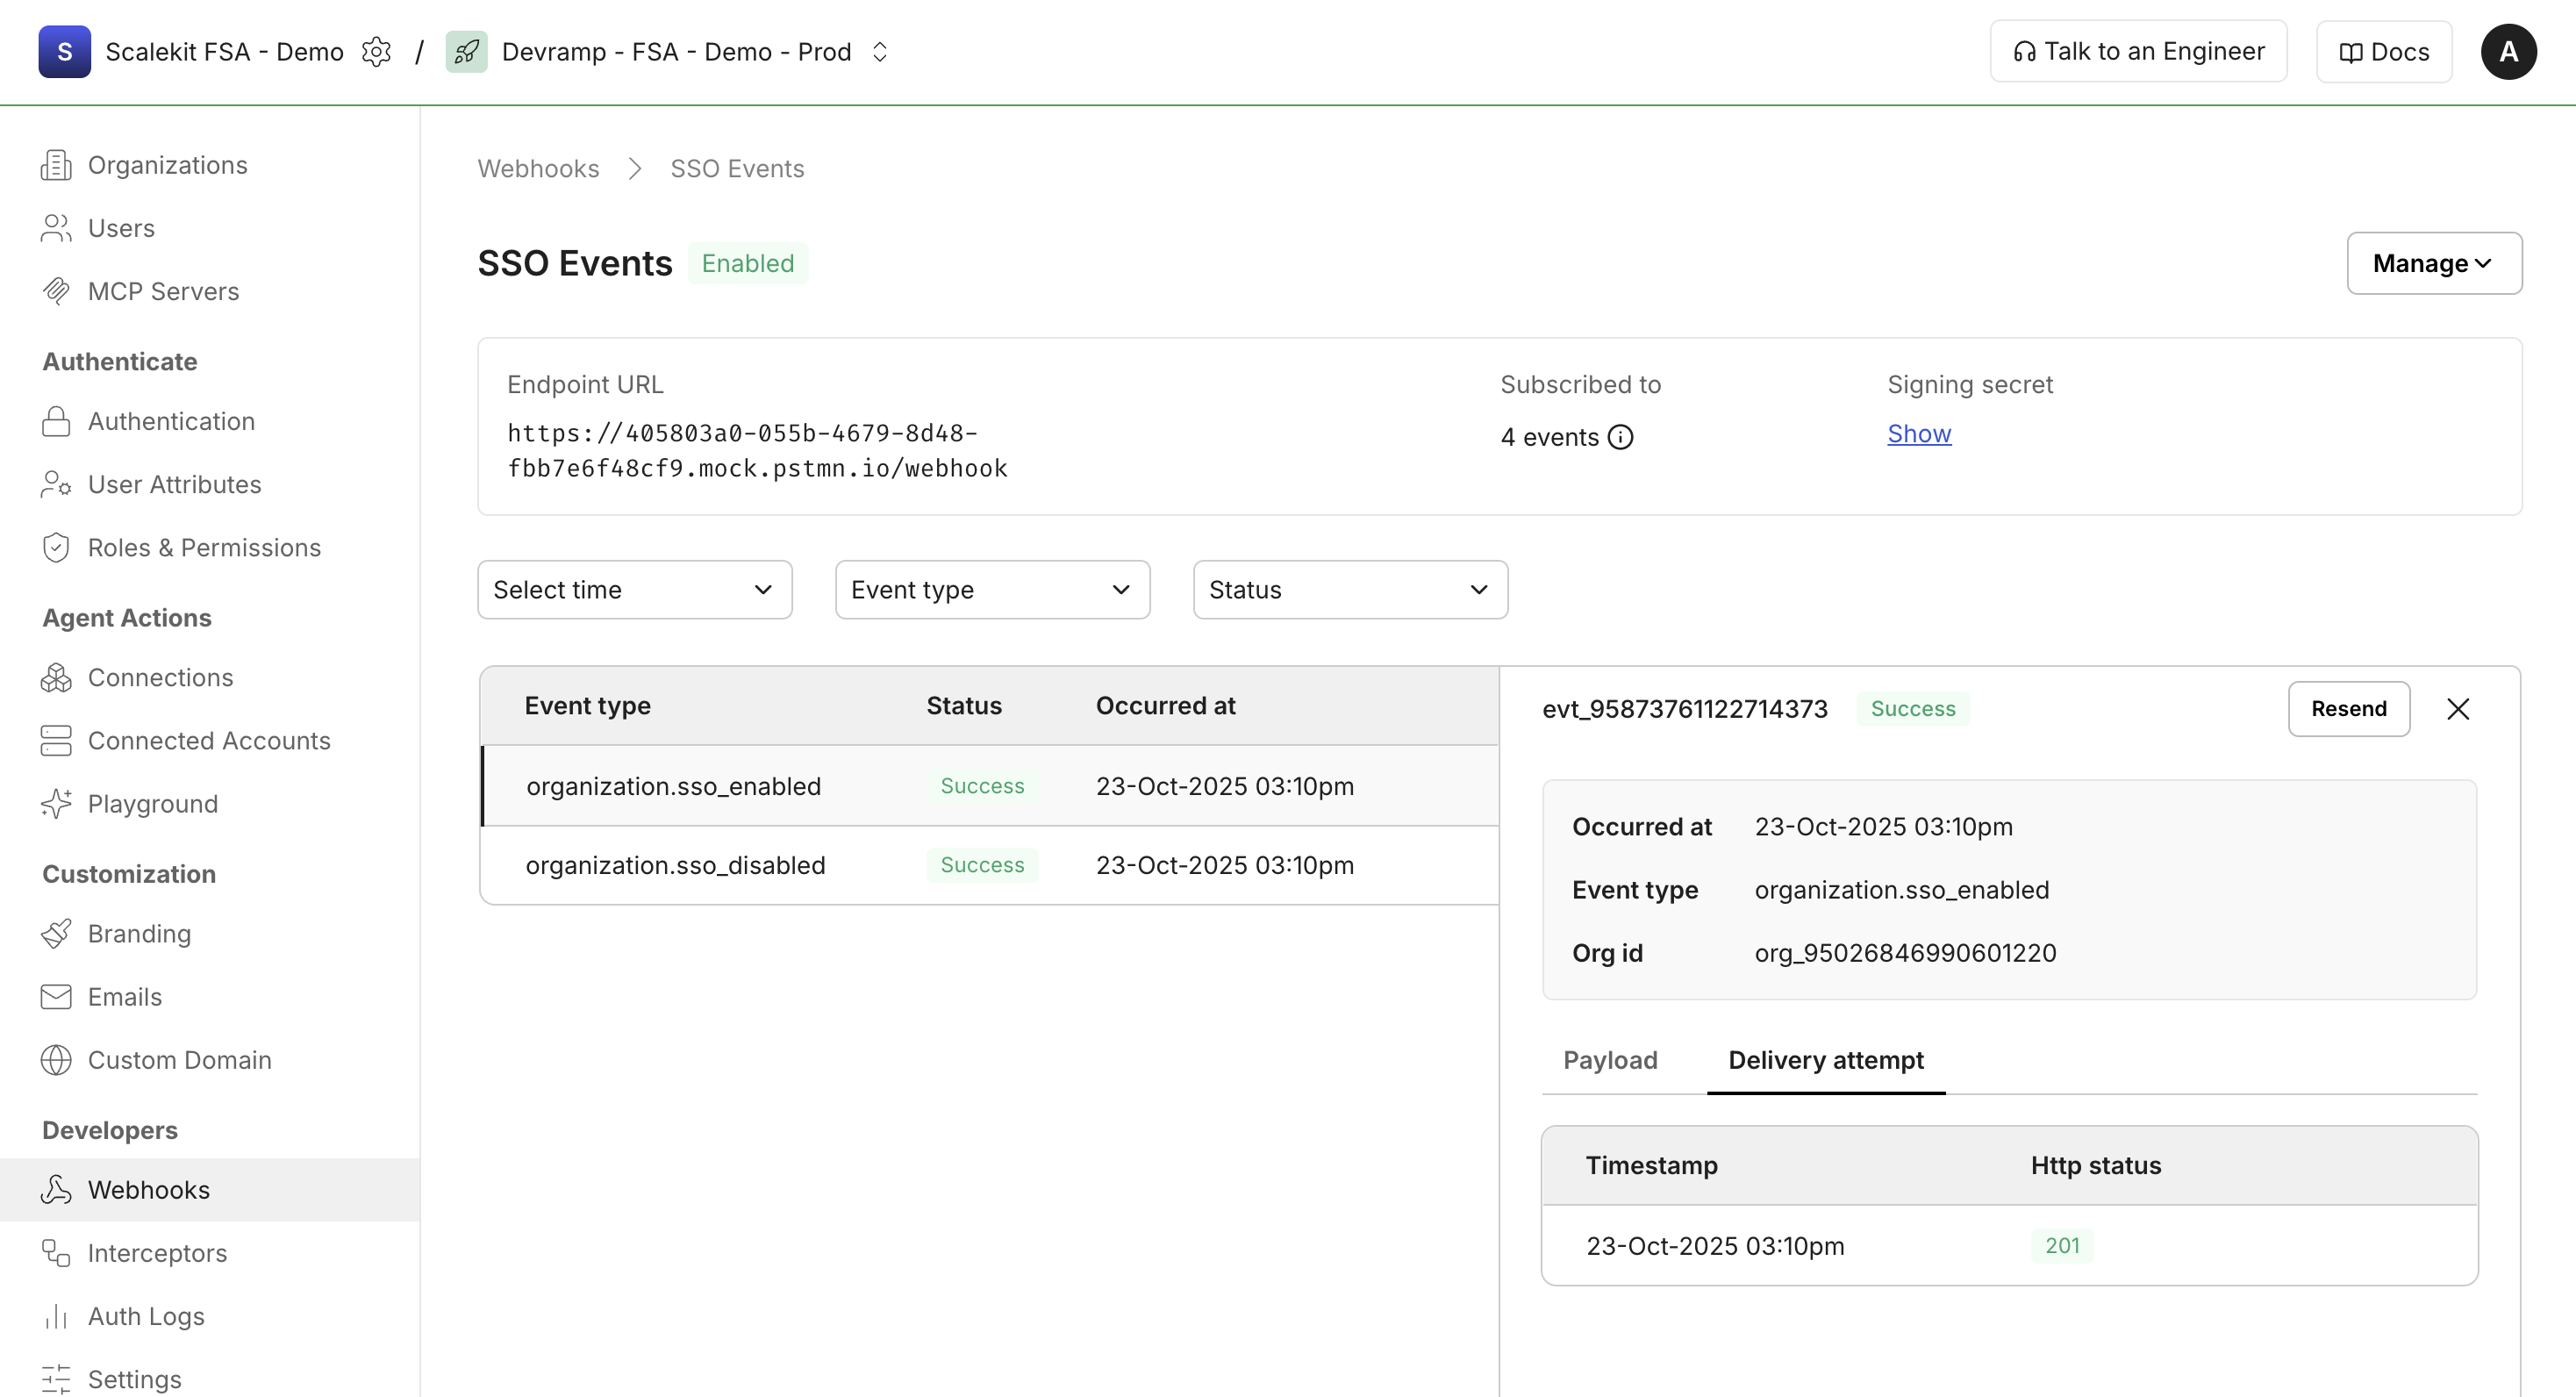
Each webhook log entry displays the webhook event details, delivery status, timestamp, and response information from your application.
Authentication statuses
Section titled “Authentication statuses”Auth logs display four different statuses that help you understand where users are in the authentication flow:
| Status | Description |
|---|---|
| Initiated | The user has started the authentication process by accessing the /oauth/authorize endpoint. This indicates they’ve begun the authorization flow but haven’t completed it yet. |
| Pending | The authentication is in a transitional state between initiation and completion. During this phase, the system performs redirects while exchanging user profile details for authorization code grants. The authentication is still in progress. |
| Success | The system successfully exchanged the authorization code grant, verified the user’s identity, and granted them access. The authentication flow has completed successfully. |
| Failure | The authentication process failed and access was denied. This could be due to invalid credentials, network issues, interceptor rejections, or other authentication failures. Review the error details to identify the cause of the failure. |
Filter auth logs
Section titled “Filter auth logs”When investigating incidents or troubleshooting issues, use filters to narrow down log data and quickly identify authentication problems.
Available filters:
- Time range - Filter logs by specific date and time periods to focus on recent activity or investigate historical events
- User email - Search for authentication events from specific users to track individual user activity or troubleshoot sign-in issues
- Authentication status - Filter by Initiated, Pending, Success, or Failure to isolate specific authentication outcomes
- Organization - View authentication events for specific organizations in multi-tenant applications
Combine multiple filters to narrow your search. For example, filter by a specific user email and Failure status to investigate why a user cannot sign in.
Webhook logs
Section titled “Webhook logs”Webhook delivery statuses
Section titled “Webhook delivery statuses”Webhook logs display four different statuses that indicate the delivery state of each webhook event:
| Status | Description |
|---|---|
| Success | Your application endpoint responded with a 2xx status code (typically 200 or 201), confirming successful receipt and processing of the webhook event. |
| Queued | Due to high event volume or rate limiting, the webhook event is queued and waiting to be sent to your application endpoint. Events are processed in the order they were created. |
| Failed | Your application endpoint did not respond, returned a non-2xx status code (typically 4xx or 5xx), or the request timed out. Failed deliveries trigger automatic retries. |
| Retrying | Your application endpoint failed to acknowledge the webhook, and Scalekit is automatically retrying the delivery using exponential backoff. Retries continue up to 4 attempts with increasing delays between retries. |
Filter webhook logs
Section titled “Filter webhook logs”When troubleshooting webhook delivery issues or investigating specific events, use filters to narrow down log data and quickly identify problems.
Available filters:
- Time range - Filter logs from the last 5 minutes to the last 30 days to focus on recent deliveries or investigate historical events
- Event type - Filter by specific webhook event types (e.g.,
organization.directory.user_created,organization.directory.user_updated) to track particular types of events - Delivery status - Filter by Success, Queued, Failed, or Retrying to isolate problematic deliveries or verify successful processing
Combine multiple filters to narrow your search. For example, filter by Failed status and a specific event type to investigate why certain events are not being processed successfully.
Webhook log details
Section titled “Webhook log details”Click on any log entry to view detailed information about the webhook delivery:
Request details:
- Event ID and type
- Timestamp when the event occurred
- Request payload sent to your endpoint
- Request headers including webhook signature
Response details:
- HTTP status code returned by your endpoint
- Response body from your application
- Response time and latency
- Retry attempt number (if applicable)
Use these details to debug webhook processing issues, verify signature validation, and ensure your endpoint handles events correctly.
Retry behavior
Section titled “Retry behavior”When webhook deliveries fail, Scalekit automatically retries sending the event to your endpoint:
Retry schedule:
- Attempt 1: Immediate delivery
- Attempt 2: After 1 minute
- Attempt 3: After 5 minutes
- Attempt 4: After 15 minutes
After the final retry attempt fails, the webhook is marked as permanently failed. You can view these failed webhooks in the logs and manually replay them when your endpoint is ready to process them.